PAICE Score™ Changes
Enhanced scoring, new results experiences, and assessment history tracking
Over the past few weeks, we've rolled out significant improvements to the PAICE assessment experience. These changes affect how scores are displayed, how results are presented, and how you can track your AI collaboration skill development over time. Here's a comprehensive look at what changed and why.
The 1000-Point Scale
What Changed
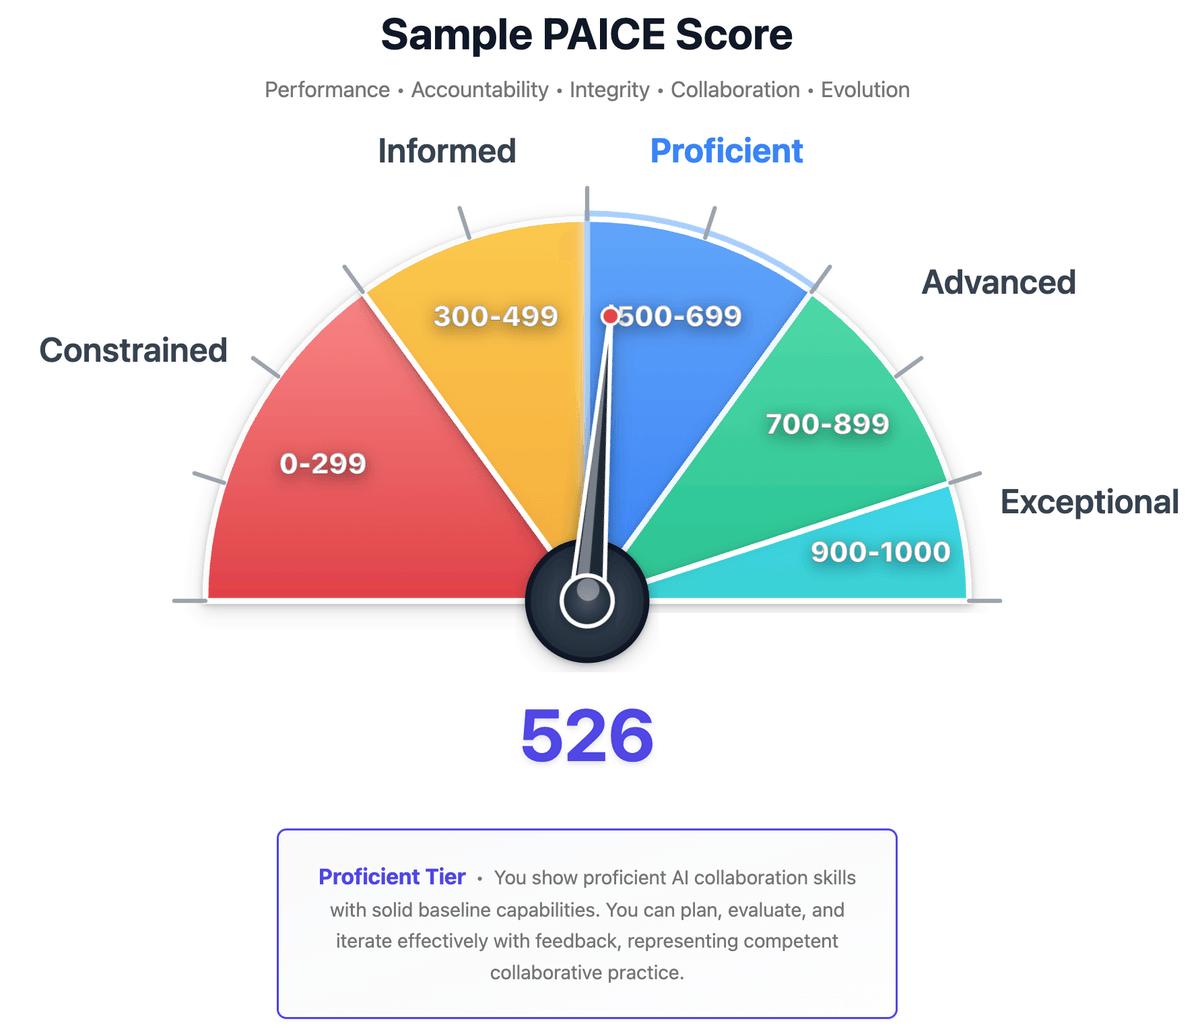
PAICE scores now display on a 0-1000 scale instead of the previous 0-100 scale. If you took an assessment before this change, your score would now appear 10x higher. So a score of 52.6 is now displayed as 526, for instance.
Why We Made This Change
Clarity: Percentage-based scoring lends itself to misinterpretation. A 52% score could be read as "52% of the way to mastery," which isn't accurate. The 1000-point scale makes it clear that this is a comprehensive assessment of your AI collaboration skills. It also avoids the common pitfall of thinking in terms of standardized test scores, which has never been our intent.
Organizational benchmarking: For Founding Partners running cohort assessments, the 1000-point scale provides the granularity needed for meaningful team comparisons and trend analysis. We had previously used decimal points to show differences between scores, but this approach turned out to be more confusing for users.
New Numbers, Same Tier Thresholds
| Tier | Score Range | Description |
|---|---|---|
| Exceptional | 900-1000 | Demonstrates mastery across all dimensions |
| Advanced | 700-899 | Strong skills with sophisticated collaboration patterns |
| Proficient | 500-699 | Solid foundation with room for growth |
| Informed | 300-499 | Developing skills, aware of best practices |
| Constrained | 0-299 | Early stage, significant growth opportunity |
Important: Your underlying assessment hasn't changed, only how the score is displayed. The evaluation methodology, dimensional weights, and tier definitions remain the same.
New Results Page Experiences
We've been testing different approaches to presenting your assessment results. You may see one of three results page variants:
Results A: Gauge Visualization

Features our usual speedometer-style gauge that shows your score position across all tiers at a glance. The gauge provides immediate visual context. You can see exactly where you fall and how far to the next tier.
Design philosophy: The score reveal should feel like receiving a professional diagnostic report, not a test grade. Context precedes judgment.
Results B: Tier Position Bar

Uses a horizontal tier bar that shows your exact position within the tier spectrum. Each tier is color-coded, and a marker shows precisely where your score falls.
Design philosophy: Strengths precede gaps. You should understand what you do well before seeing areas for growth.
Results C: Radar Chart

Displays your performance across the five PAICE dimensions on a radar chart. This visualization emphasizes your relative strengths and weaknesses across the full spectrum of AI collaboration skills, letting you see your shape and position relative to others.
Design philosophy: The radar chart provides a comprehensive view of your AI collaboration profile, showing how your skills align with the full range of capabilities.
What's Common Across All Variants
All three results experiences share these improvements:
- Calibration context first: Before seeing your score, you'll see context about typical first-time scores (200-400) and that these skills are learnable
- Strengths before growth areas: Your demonstrated strengths appear before development opportunities
- Conditional sharing: Social sharing options appear only for scores ≥500; lower scores emphasize saving your baseline for progress tracking
- Improved dimensional charts: Clearer visualization of your performance across the five PAICE dimensions
Assessment History Dashboard
You can now track your AI collaboration skill development over time with the new Assessment History Dashboard.

What It Shows
- Historical scores: See all your past assessments with dates and scores
- Trend visualization: Track whether your skills are improving over time
- Dimensional progress: See how specific dimensions (Performance, Accountability, Integrity, Collaboration, Evolution) have changed
How to Access It
The "Show History" button appears on the home page when you have valid assessment history. Click it to view your complete assessment timeline.
Privacy Note
Assessment history is linked to your browser via an anonymous user hash, not your email or personal information. Currently, if you clear your browser data or use a different device, your history will no longer be visible (though it's still stored securely in our database). This limitation will be addressed in a future update to allow portability across browsers/devices.
Backend Score Tracking Unchanged
As we’ve implemented all these changes (and more) in the UI, we’ve kept the actual data and calculations the same in the database. No migration or versioning of existing scores was required, all remain just as valid.
What This Means for You
For Individual Users
- Clearer scores: The 1000-point scale makes progress more visible
- Better context: Results pages now explain what your score means before showing it
- Progress tracking: The History Dashboard lets you see improvement over time
- Reliable assessments: Backend improvements mean fewer interruptions
For Organizations (Founding Partners)
- Granular benchmarking: The 1000-point scale supports meaningful cohort comparisons
- Audit trails: Request tracking provides compliance-ready logging
- Consistent reporting: Centralized score transformation ensures accurate organizational reports
- Reliable at scale: Middleware improvements support high-volume cohort assessments
Looking Ahead
These changes lay the groundwork for upcoming features:
- Longitudinal tracking dashboard: More sophisticated trend analysis for organizations
- Custom reporting engine: Tailored reports for different stakeholder needs
- Enhanced cohort analytics: Deeper insights into team-level patterns
Though we’ve updated all our support and FAQ content to this new scoring system, our legacy blog posts have not yet been updated. We will add a notice on the appropriate entries that reference 0-100 scores that links to this new 0-1000 method soon. Previous Substack posts will be updated with similar language eventually as well.
Questions?
If you have questions about these changes or notice anything unexpected with your scores, please contact us. We're committed to making the PAICE assessment experience as clear and valuable as possible.
Get Involved:
- Take the assessment (free, always)
- View your assessment history (if you have past assessments)
- Explore the Founding Partner Program (for organizations)
- Read the whitepaper (comprehensive framework)
- Contact us with questions
Related Reading
متجسس لیکن وقت کم ہے؟
3 منٹ کا PAICE Pulse کریں — ایک فوری اعتماد چیک جو یہ ظاہر کرتا ہے کہ آپ اپنی AI تعاون کی پوزیشن کو کیسے دیکھتے ہیں۔ لاگ ان کی ضرورت نہیں۔